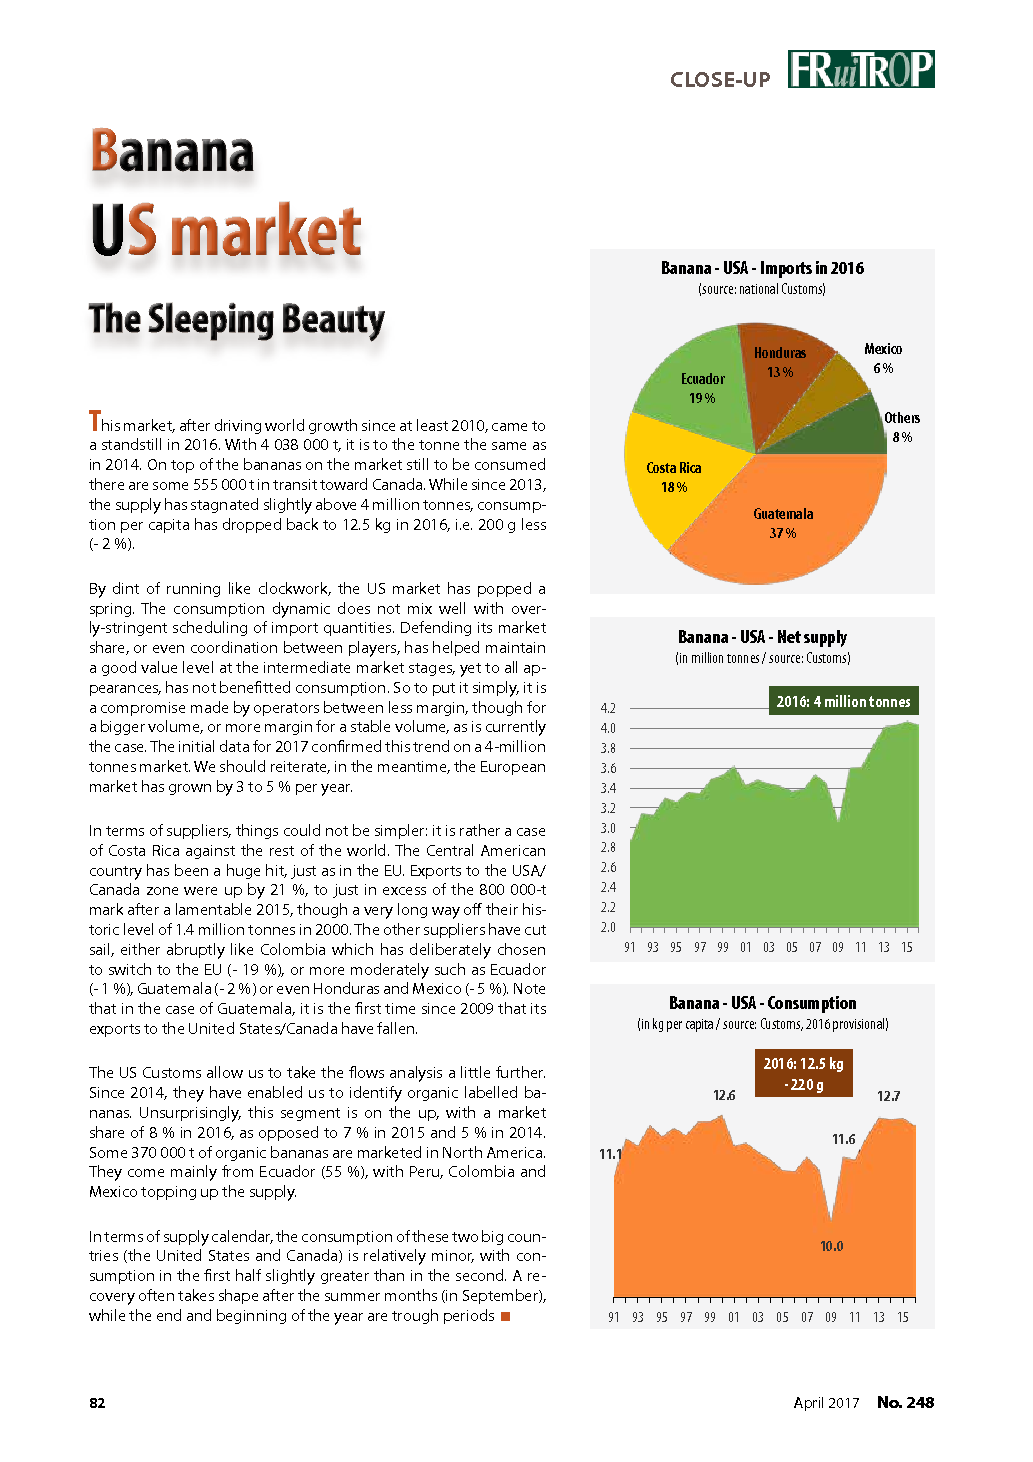
This market, after driving world growth since at least 2010, came to a standstill in 2016. With 4 038 000 t, it is to the tonne the same as in 2014. On top of the bananas on the market still to be consumed there are some 555 000 t in transit toward Canada. While since 2013, the supply has stagnated slightly above 4 million tonnes, consumption per capita has dropped back to 12.5 kg in 2016, i.e. 200 g less (- 2 %).
By dint of running like clockwork, the US market has popped a spring. The consumption dynamic does not mix well with overly-stringent scheduling of import quantities. Defending its market share, or even coordination between players, has helped maintain a good value level at the intermediate market stages, yet to all appearances, has not benefitted consumption. So to put it simply, it is a compromise made by operators between less margin, though for a bigger volume, or more margin for a stable volume, as is currently the case. The initial data for 2017 confirmed this trend on a 4-million tonnes market. We should reiterate, in the meantime, the European market has grown by 3 to 5 % per year.
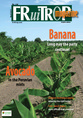
In terms of suppliers, things could not be simpler: it is rather a case of Costa Rica against the rest of the world. The Central American country has been a huge hit, just as in the EU. Exports to the USA/Canada zone were up by 21 %, to just in excess of the 800 000-t mark after a lamentable 2015, though a very long way off their historic level of 1.4 million tonnes in 2000. The other suppliers have cut sail, either abruptly like Colombia which has deliberately chosen to switch to the EU (- 19 %), or more moderately such as Ecuador (- 1 %), Guatemala (- 2 %) or even Honduras and Mexico (- 5 %). Note that in the case of Guatemala, it is the first time since 2009 that its exports to the United States/Canada have fallen.
The US Customs allow us to take the flows analysis a little further. Since 2014, they have enabled us to identify organic labelled bananas. Unsurprisingly, this segment is on the up, with a market share of 8 % in 2016, as opposed to 7 % in 2015 and 5 % in 2014. Some 370 000 t of organic bananas are marketed in North America. They come mainly from Ecuador (55 %), with Peru, Colombia and Mexico topping up the supply.
In terms of supply calendar, the consumption of these two big countries (the United States and Canada) is relatively minor, with consumption in the first half slightly greater than in the second. A recovery often takes shape after the summer months (in September), while the end and beginning of the year are trough periods.


