
FruitTrop Magazine n°240
April 2016 -
Avocado &
Banana close-ups
- Publication date : 11/05/2016
- Price : Free
- Detailled summary
- Articles from this magazine

As on any competitive market short on innovation (very little segmentation), a source’s market share depends in large part on its level of price competitiveness.
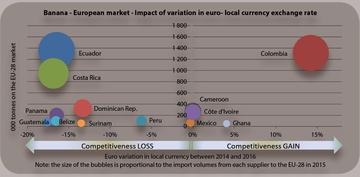
Hence it seems reasonable to look at production costs. Yet this information is hard to access, and the diversity of situations in most of the sources means that an average by country is too rough. In addition, companies integrate more or less functions (e.g. logistics), or they develop a multinational approach (employing tax avoidance strategies). In this case, the accounts are the expression of primarily a financial rather than an economic rationale. Hence we will approach the issue in another way, by seeing whether exchange rate variation between 2014 and 2016 had a depressive or boosting impact on the overall competitiveness of a given source. The picture proposed demonstrates this treatment applied to practically all the sources which export to the European market.
It is no long task to describe the winners and losers in the exchange rates lottery; they can easily be grouped into three sets. The first is practically a single source, the winners’ group in which Colombia has performed brilliantly, since between 2014 and 2016, thanks to the annual average exchange rate mechanism, its competitiveness increased by 14 %! Ghana can also be tagged onto this set, though with much more modest gains: of around 4 % and down a long way from previous years. The second set comprises the CFA franc zone countries (Cameroon and Côte d’Ivoire), which have a fixed exchange rate with the euro, but also Mexico, whose currency has varied very little against the euro. Finally, the last group is the losers, with a tight bunch of Ecuador, Costa Rica, the Dominican Republic, Panama, etc. There, the depressive effect due to the exchange rate has varied between - 13 and - 18 %. Peru has also lost competitiveness, but the damage was limited to -6 %.
In summary, the variation in the competitiveness gap is no less than 32 %, between Colombia (+14 %) and Guatemala (-18 %)! It all boils down to knowing whether this gulf has shifted the lines both in terms of relative market shares and a possible trade-off between the USA and EU for example. It is hard to draw a definitive conclusion over a single year, but we can say that there is a relationship between the depressive effect of the exchange rate and exports to the EU or to the United States. Colombia climbed steeply on the EU market in terms of volume (+21 %) and improved its competitiveness by 14 %. Conversely, Ecuador had an 8% smaller presence in the EU, apparently handicapped by an unfavourable exchange rate (- 16 %). At the same time, the Ecuadorian trade-off was clearly in favour of the EU market. Costa Rica limited the damage with a near-stable presence in terms of volumes (+ 1 %), and a major negative exchange rate impact of 17 %. In a context of its generally falling exports, the EU has remained its favourite market.
We should be wary of trying to explain everything through exchange rate variation, since certain countries cannot choose between several markets, and production is subject to vagaries other than just exchange rate (diseases, climate events, social unrest, etc.). We should also isolate the effect of increases in surface area or improved productivity, and then a cost structure encompasses purchases in different currencies, etc. Furthermore, for highly exceptional sources (Fairtrade and organic bio), such as the Dominican Republic or Peru, the competition is less comprehensive and head-on with other sources. Nonetheless it is interesting to observe how a factor outside the sector, with little scope for control, can affect the economic returns in producer countries.


Click "Continue" to continue shopping or "See your basket" to complete the order.